

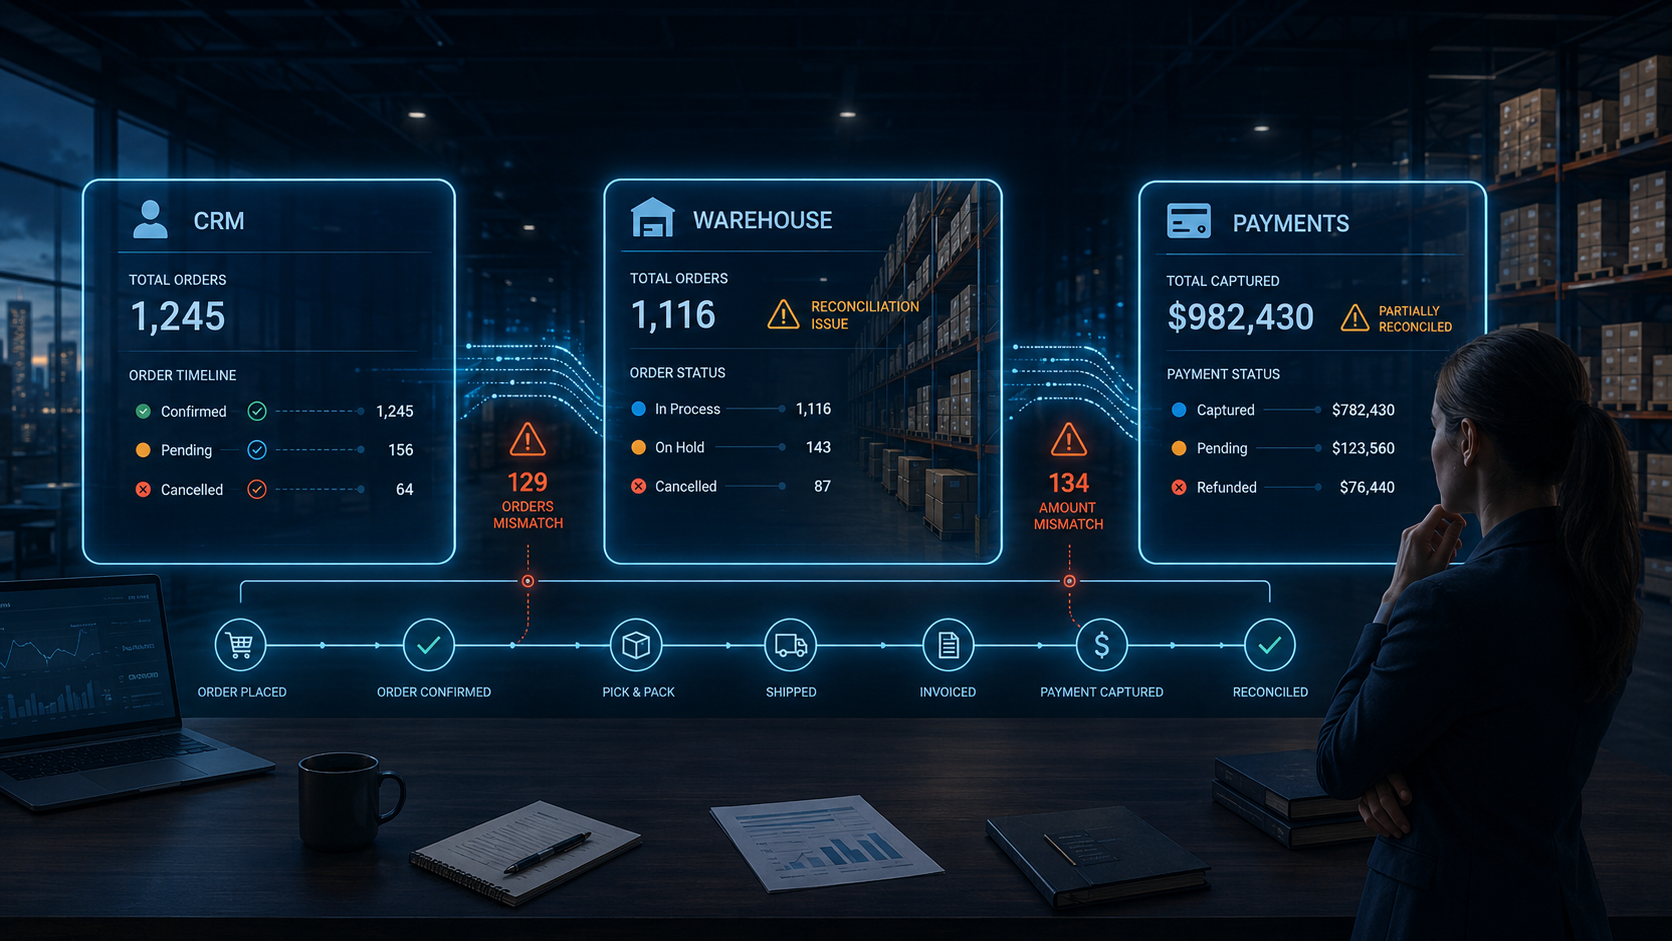
When Three Accurate Reports Tell Different Stories
At 8:12 on a Monday morning, a logistics director opens the weekly operating review with what should be a simple question: How much did the business sell last week?
The CRM shows $1.24 million. The warehouse dashboard shows $1.17 million shipped. The payment processor shows $1.09 million collected. Within minutes, sales is defending its pipeline, operations is checking delayed orders, and finance is asking whether refunds were booked twice.
This is a composite scene, but the conflict is familiar. The instinct is to decide which report is wrong. Often, none of them is. Each system records a different stage of the commercial journey: a customer commitment, a physical movement of goods or a financial transaction. The reports become misleading only when those stages are treated as interchangeable.
For logistics, 3PL, retail and manufacturing teams, the cost is not merely an untidy dashboard. A disputed number can delay carrier decisions, obscure cash exposure, distort inventory planning and weaken confidence in every subsequent report. The cure begins with a less dramatic question: What, precisely, is each system counting?

What Each System Is Built to See
A CRM is designed to describe customer relationships and commercial intent. A warehouse management system records inventory events and fulfillment. A payment platform records authorizations, captures, refunds, fees, disputes and payouts. A data warehouse copies and transforms some or all of those records for analysis. Those systems can be integrated and still disagree because integration moves data; it does not automatically align meaning.
That distinction is central to WebMagic’s guidance on connecting CRM, ERP and warehouse systems: field mapping, synchronized workflows and centralized reporting are related but separate design problems. Its work on WMS-to-Power BI integration makes the same operational point from another angle: refresh frequency, data structure and validation determine whether a dashboard is current and comparable.
The disagreement, in other words, is usually not a contest between truth and error. It is a collision among definitions, timelines and levels of detail.

The Six Reasons Totals Diverge
The reports measure different business events.
A CRM may count an opportunity when it is marked “closed won.” The warehouse may count the corresponding order when inventory is allocated, picked, packed or shipped. Payments may count it when a charge succeeds, when the funds become available or when a payout reaches the bank.
Salesforce documentation notes that opportunity reporting depends on stage types and their mapping. Stripe, meanwhile, distinguishes among the time a charge is created, the date its funds become available and the effective date of the related payout.
That means “revenue,” “orders” and “sales” are not self-defining labels. A $10,000 order can appear in the CRM on Friday, leave the warehouse on Monday and settle on Wednesday. The totals differ because the clocks start at different business events.
Time zones, cutoffs and refresh schedules move records across periods.
A report filtered from midnight to midnight in New York will not match one calculated in UTC or Bratislava. Stripe says its financial reports can use either an account’s local time zone or UTC. The choice affects both date-range filters and the timestamps displayed in the report. Stripe also says daily financial-report data is generally available by noon the following day, while its Sigma environment exposes a separate data-load timestamp.
The warehouse dashboard may refresh every 15 minutes, while the data warehouse loads hourly and finance closes the day only after bank settlement. Near the end of a month, a few hours of latency can move large batches of orders into different periods. This is not a rounding problem. It is a boundary-definition problem.
Statuses evolve, but reports preserve different moments.
Orders and payments are state machines. An order can move from confirmed to allocated, partially shipped, delivered, returned and canceled. A payment can be authorized, captured, refunded or disputed. A subscription can be incomplete, active, past due, unpaid, paused or canceled. Stripe’s subscription documentation shows that creation, payment success and access eligibility do not always occur at the same moment.
WebMagic’s article on scaling subscription billing without breaking access control and its Orbit Back payment-platform case study illustrate the practical consequence: payment infrastructure supplies events, but the application still needs business rules that decide what those events mean for access, eligibility, fees and payouts.
The CRM may preserve the original sale. The WMS may reduce shipped quantity after a return. The payment report may show the refund several days later. Shopify explicitly warns that chargebacks are excluded from sales reports and documents situations in which returned taxes appear differently in sales and payment reports. The mismatch may therefore be correct lifecycle accounting rather than a defect.
Gross sales, net sales and cash are different amounts.
Sales teams usually discuss gross order value. Operations may focus on merchandise shipped, excluding canceled lines. Finance may need net sales after discounts, returns and taxes. Treasury cares about cash after payment fees, currency conversion, reserves and other adjustments.
Stripe’s balance reporting separates gross, fee and net values and includes charges, refunds, disputes, adjustments and fees in balance activity. Its payout reconciliation report exists specifically to connect bank payouts with the transactions that produced them.
A CRM total should not be expected to equal a bank deposit unless the reporting model explicitly subtracts every intervening component. A warehouse report may come closer to invoiced merchandise value, but it will still omit payment-processing costs and may treat taxes, freight and returns differently.
The same order has different identities and levels of detail.
One CRM account can contain several contacts and shipping addresses. One commerce order can split into multiple warehouse shipments. Partial fulfillment, partial capture and partial refund events can create several records around a transaction that began as a single sale.
Problems appear when reports join those records using customer names, email addresses or editable order references. A changed email can break a match. A reused purchase-order number can create duplicates. A shipment-level table joined directly to an order-level payment table can multiply revenue once for every parcel.
The durable approach is to preserve source identifiers and maintain a cross-system key map: CRM opportunity ID, commerce order ID, order-line ID, shipment ID, invoice ID, payment ID, refund ID and payout ID. WebMagic emphasizes data mapping in its CRM and warehouse integration guidance because differently named or structured fields can make the same business object appear unrelated across systems.
Pipelines lose, duplicate or reorder events.
Even a modern API integration is not necessarily a perfectly ordered stream. Stripe can retry undelivered webhook events for up to three days. Its documentation advises applications to recognize events that have already been processed, and its API supports idempotency keys so that a safely retried request does not accidentally perform the same operation twice.
Stripe also states that delivery order is not guaranteed for certain event destinations. A later business state can therefore arrive before an earlier event, depending on the integration path.
A warehouse or commerce system may process the same update twice after a timeout, or it may receive a refund event before a delayed payment event. Failed extraction jobs, API rate limits, schema changes and incomplete backfills add another layer of risk. A data warehouse can be online and queryable while still being stale or internally inconsistent.

A Reconciliation Playbook for Operations and Finance
The first reconciliation meeting should not begin with a dashboard redesign. It should begin with one disputed metric and a written contract.
Define the business event: Is an order counted at booking, payment, allocation, shipment, delivery or settlement? Define the grain: one row per order, order line, shipment, payment or payout. Define the inclusions: taxes, freight, discounts, fees, refunds, returns and chargebacks. Define the clock: event timestamp, time zone, cutoff and expected latency. Then name the authoritative source for every field.
This is the logic behind a semantic layer. dbt describes the principle as defining critical metrics centrally so that downstream tools and applications use consistent calculations. Its documentation calls this the ability to “define metrics once, centrally.”
WebMagic’s complex integration services apply the complementary engineering controls: field mapping, validation, data synchronization and connected workflows across CRM, ERP, e-commerce and logistics platforms.
Teams should also maintain a reconciliation bridge rather than demand instant equality. Start with CRM booked value. Subtract canceled and unfulfilled lines. Account for shipments that crossed the reporting cutoff. Subtract refunds, disputes, processor fees and currency effects. The remaining value should reconcile to the payment balance or payout for the same defined period.
Automated controls should flag missing identifiers, duplicate event IDs, orphan refunds, negative quantities, unmapped statuses and late-arriving records. The dashboard should display the timestamp of its last successful load. A discrepancy threshold should trigger investigation, but expected differences should be labeled rather than “fixed” away.
The same discipline applies to logistics reporting. WebMagic’s work on automating shipment tracking through TMS and CRM integration emphasizes synchronized order details, shipment statuses, estimates and billing data. Those connections improve visibility, but they still require explicit ownership of definitions and careful monitoring after launch.

The Goal Is Explainable Difference
The strongest reporting system is not the one in which every screen displays the same number. It is the one in which every difference can be explained from customer promise to warehouse movement to cash settlement.
When a logistics director can trace a sale through those stages, the Monday meeting changes. Sales no longer argues with finance over whose report is true. Operations can see which orders have not crossed the dock. Finance can see which shipped orders have not become cash.
The organization has something more useful than a superficially uniform dashboard: a shared map of how truth changes as the business moves.